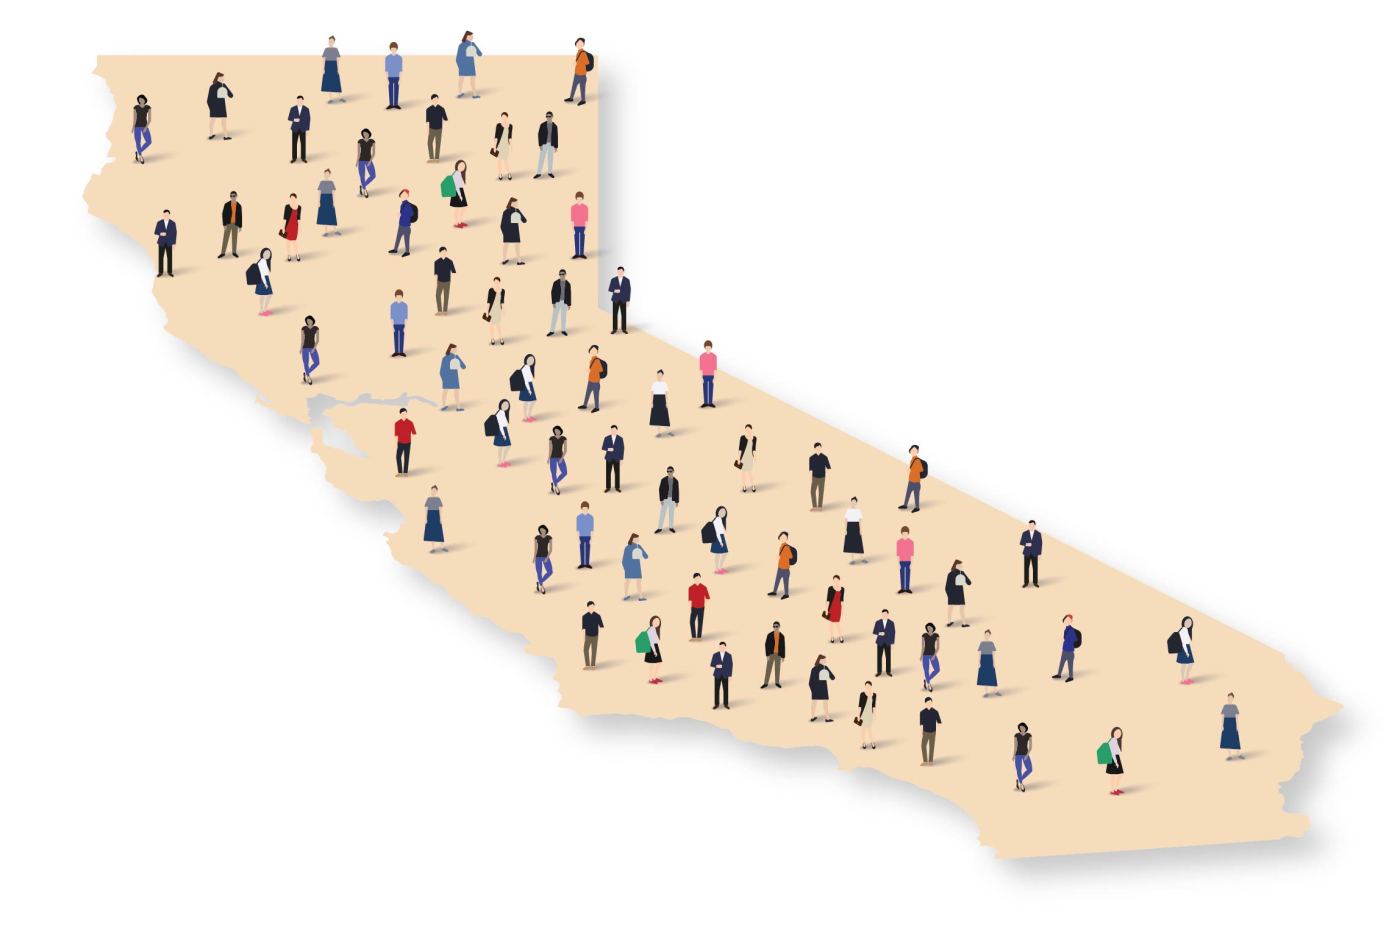
The United States is a nation of immigrants, and California even more so, with twice the national percentage of immigrants. Just over a quarter of California’s roughly 40 million residents were born elsewhere, but in many parts of the Bay Area, immigrants account for over a third of the population.
Santa Clara County has the state’s highest proportion of immigrants, with 41% of residents born outside of the country. San Mateo, San Francisco and Alameda counties are next on the list, with between 34% and 36% immigrants. All four of those Bay Area counties have a higher rate of immigrants than Los Angeles County, where one-third of residents are immigrants.
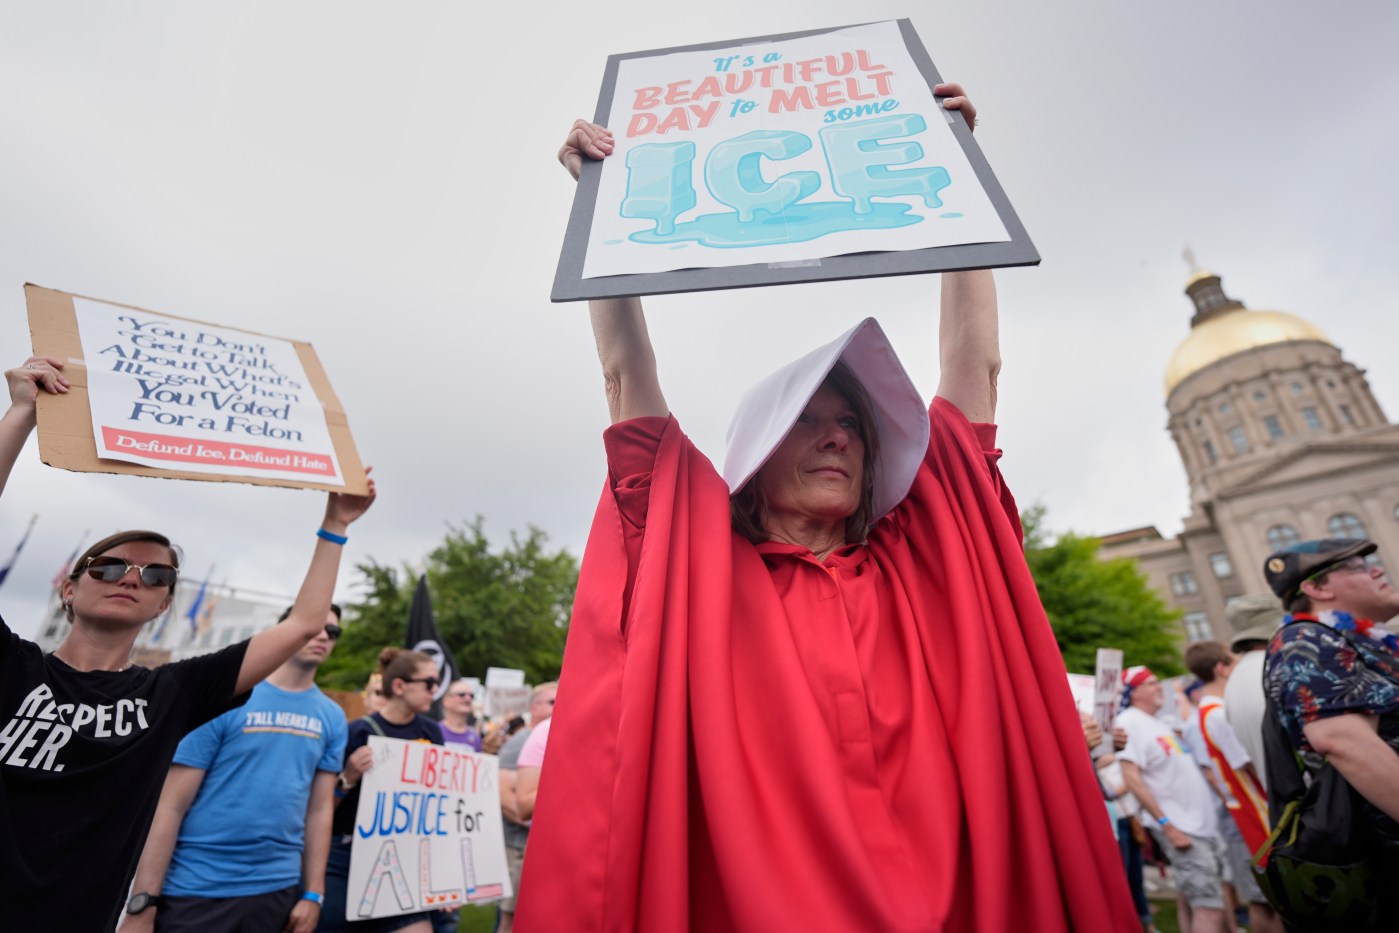
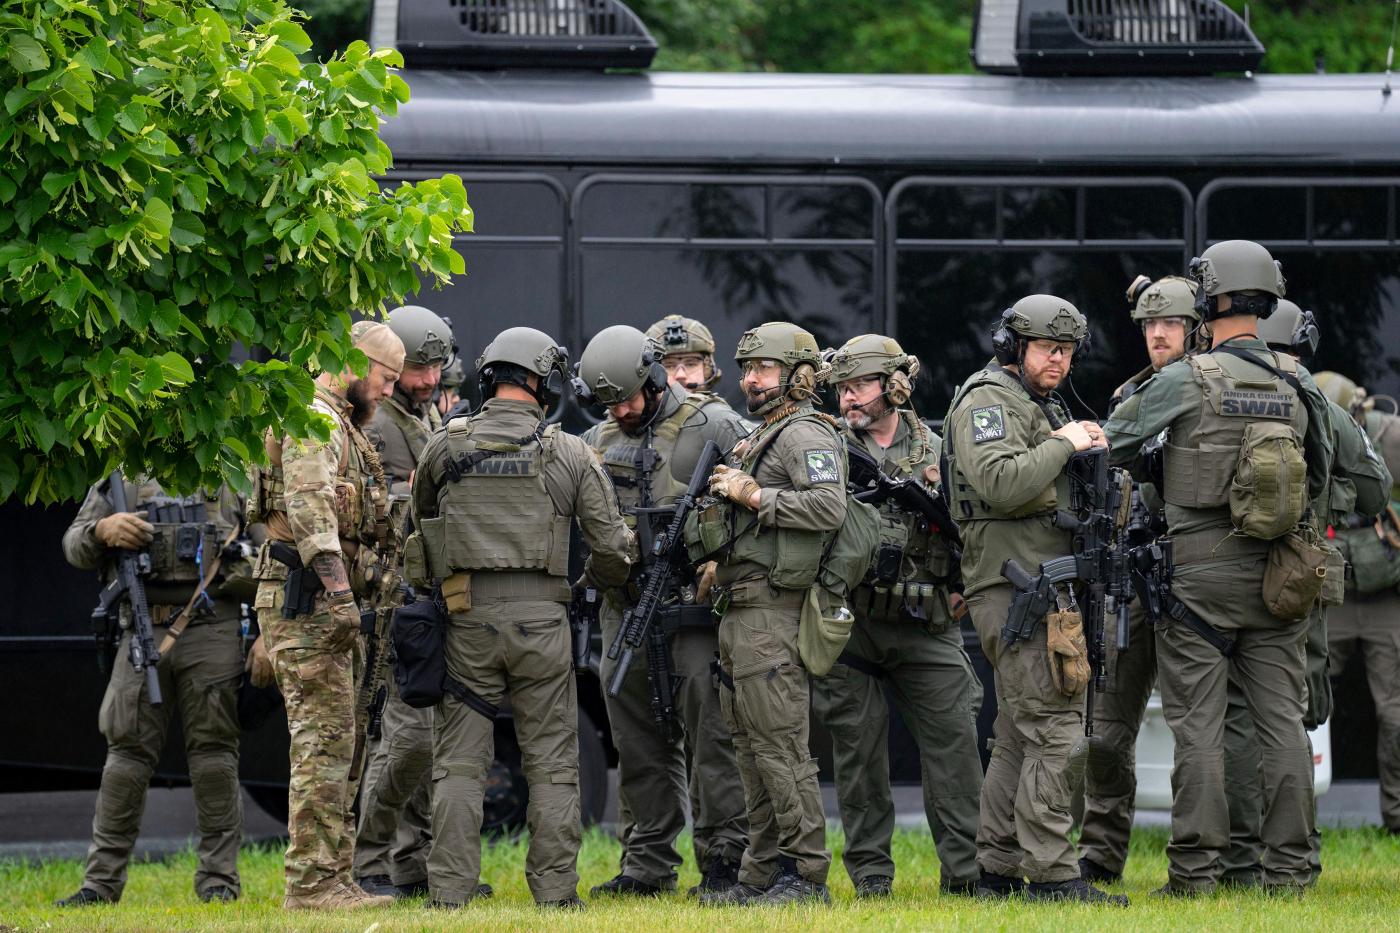
While immigration raids in Los Angeles have dominated the news, with President Donald Trump making good on campaign promises to increase immigration enforcement, the Bay Area’s population is also especially vulnerable to changes in immigration policies, including H1-B visa policies, and other changes to federal policy because of the large immigrant population.
While the U.S. Census Bureau’s American Community Survey does not collect data on the legal status of non-citizens, a report from the Migration Policy Institute estimates that as of 2023, 73% of immigrants in the country were naturalized citizens, had permanent legal status, or were on temporary work visas. The remaining 27% of immigrants in the country are “unauthorized,” according to the report.
In Fremont and Sunnyvale, half of residents were born outside of the United States. Only one of California’s 100 largest cities has a higher percentage of immigrants: Glendale, a city in Los Angeles County adjacent to Griffith Park that is known for its large Armenian population.
Around the Golden State, there are just over 24 million naturalized U.S. citizens, people who were born elsewhere but now have U.S. citizenship. And there are nearly 22 million people living in California who are not citizens, including those here temporarily, those with work authorization, those seeking asylum, and those without formal authorization.
We also know that the Bay Area gets a disproportionate number of the country’s H1-B visa beneficiaries, mostly highly skilled workers, especially in tech.
In part due to the region’s high number of immigrant tech workers, Santa Clara County has a higher proportion of both naturalized U.S. citizens and non-citizens compared to other counties in the region. And the number of non-citizens has grown by 15% since 2010, more than in any other Bay Area county.
In San Francisco, Solano, Marin, Sonoma and Napa counties, there are now fewer non-citizen residents than in 2010, while San Mateo, Contra Costa, Alameda and Santa Clara counties have more non-citizens than 13 years before.
Around the country, there are now about 50 million immigrants, more than ever before. Proportionally, immigrants now make up nearly 15% of the nation’s residents, similar to the rate in the late 1800s. In the first part of the 20th century, the share of U.S. residents who were immigrants dropped to just over 5% by 1970, but that figure has been growing consistently since then.
Statewide, Mexico is by far the most common country of birth among immigrants, but the share of immigrants from our neighbor to the south is shrinking. In 2010, there were 4.3 million people living in California who were born in Mexico. Now that total is 3.8 million. Coming in second on the list is the Philippines, where over 800,000 California residents were born. Another nearly 700,000 residents were born in China, and India was fourth on the list in 2023, moving steadily up the ranks over the past decade.
In the Bay Area, immigrants are coming from different places than a decade ago. In 2018, the number of Indian immigrants in Santa Clara and Alameda counties surpassed the number of residents born in Mexico.